


Is your product shelf keeping up with the sales?
Sales volume data provides a fairly decent insight into the market and your company’s position in relation to the competition....
Sales volume data provides a fairly decent insight into the market and your company’s position in relation to the competition. What analyses based on sales reports will often leave out, however, is some important information which determines not only the accuracy of managers’, but also sales representatives’ decisions.
Imagine your company’s product X earns you a 30% share of sales in its category. Surely you would like to know if this is the maximum this product can make, or if there is still an opportunity for you to increase sales.
Another example: a new product that fails to impress. Despite heavy investment in promotion and an attractive shelf position, its sales results do not exceed those of the competition, and are additionally poorer than the results of an older product from the same category that drives your sales
What decisions concerning these products should a sales representative take when visiting the store?
The classic rule that the customer decides at the shelf, which applies 7 out of 10 purchase decisions, suggests that it is product display that could be the key to exploiting the full sales potential of our products, especially if we do not wish to nervously manipulate prices. Therefore, in order to obtain information that will help us act effectively, we need to combine fair share with reliable share of shelf data
… and see what comes of it.
If a shelf share analysis of the first case shows that the product takes a mere 15% of display space (vs. 30% of the share of sales in the category!), the natural conclusion is that the store needs to improve not only the visibility of the “champion” within our product portfolio, but also to correct the arrangement of competitors’ products, among which there will certainly be some that do not bring the expected profits to their manufacturer or vendor. However, this is only going to work if the reasoning is based on reliable data.
The second case, the disappointing novelty which until recently has been positioned in the golden zone, should probably be replaced with your better rotating product and its shelf space reduced approximately to the width reflecting its share in sales – let’s assume a decrease from 40% to 10% of facings.
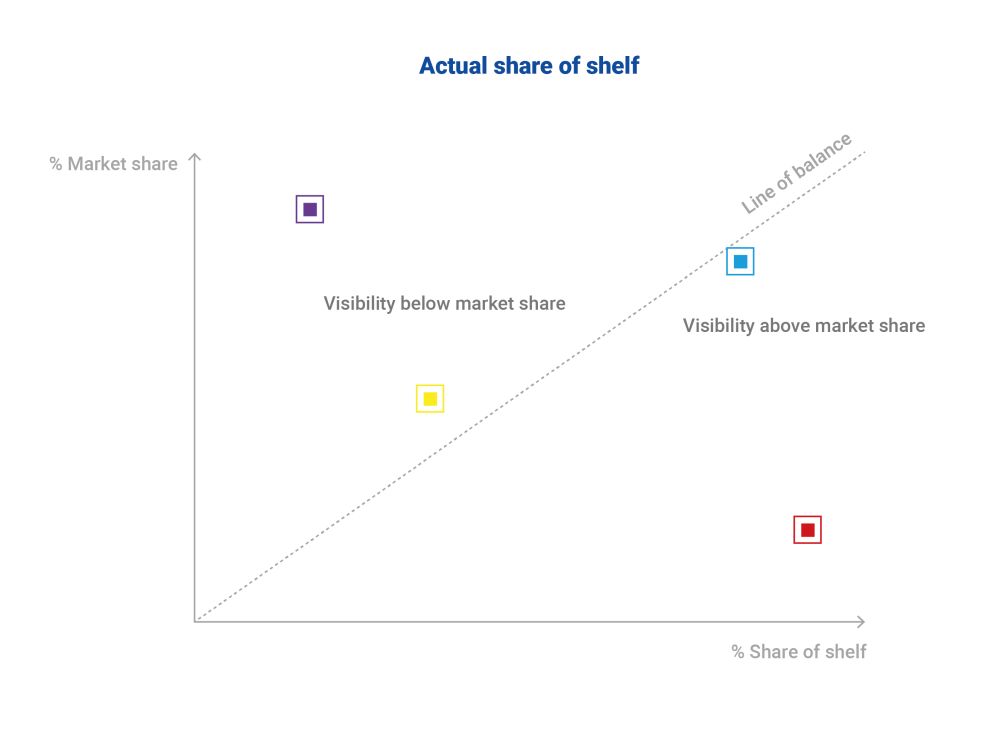
The balance between market share value and share of shelf is a useful model that can be adapted to the particular characteristics of your own business (e.g. the ratio of Share of Shelf to Fair Share could be 1.2 “in favor of” sales). Such an approach is only possible, however, if the share of shelf data comes to us regularly and truly reflects what is happening to the display.
If the share of a category in the shelf is higher than the desired market share, then it most likely means that the category does not rotate in line with the vision of the category manager, and therefore its distribution and storage costs are wasted. If the opposite is true, it may suggest that the category is underinvested and has much higher potential than its sales indicate.
The beautiful idea of seeking a perfect relationship between sales and display remains only a dream if you have your representatives report such extensive and difficult to calculate data manually (even using the most efficient SFA system). Measuring the product’s share of shelf every time a representative visits a store ultimately leads to eyeballing or copying data from previous visits, which in turn can be disastrous for future decisions. Gradually, such examinations became rare, then not obligatory, sometimes they are delegated to agencies, and finally, due to their cost and time-consuming character, they die a natural death.
Read also
- Over 50 criteria for selecting AI merchandising application [+BONUS]

- Energy drinks 2024: industry view through the lens of AI

- How to maintain merchandising standards and a perfect store thanks to AI [VIDEO]

- Price on shelf different from price at checkout – what should the shop do?

Bear in mind that poor quality data that does not cover the desired part of the sales network or comes from selective, sporadic surveys will not let you capture the moments of change even if you are equipped with the most powerful business intelligence system. Therefore you cannot build a sound marketing, pricing and distribution strategy on such data.
Automation comes to your aid in solving this problem. A tool that accelerates and objectivizes the share of shelf analysis can make perfectly feasible what previously seemed impossible. Photo research reports generated by artificial intelligence will rapidly and accurately assess the potential of the products in your portfolio. This way, you will correctly assign the right strategy to each of them.
What else can you obtain with shelf audit automation?
- information on which of your competitors’ products is closest to the given one,
- an argument for the store to add an underrepresented product to the shelf,
- an argument for the store to replace an overrepresented product of your competitors with your own product,
- information whether your distribution is keeping pace with marketing,
- an insight into which retail chain under-reports sales by means of in-store display,
- …dozens of other hypotheses which your analysts will be happy to tackle.😉
eLeader Shelf Recognition AI – a robustly developed tool which is an endless source of inspiring data and competitive advantages. Our clients have already found this out – now it’s your turn.
Find out how Shelf Recognition AI can support your in-store display strategy
Read also:

Image recognition and artificial intelligence in sales and merchandising
It is over 20 years since Garry Kasparov lost to the supercomputer Deep Blue. We can deem that moment to be the beginning of the modern era of artificial i...